In my last post, I suggested that digital attribution without consumer tracking can be extremely effective. If you haven’t read that yet, I’d recommend doing so because this post assumes that you already see the reason for / value of a probabilistic approach to attribution.
Instead of discussing the why, then, I’m going to discuss the what of probabilistic attribution. More specifically, I’m going to show what you, as a marketer, can get out of this approach and what you’ll need in order to get it. Bring on the charts!
What do you need?
Let’s use my company (via some simulated data) as a case study. I want to know which of Slick Predict’s marketing channels produce the best results per dollar.
Say I have four distinct digital marketing channels at Slick Predict: Facebook, LinkedIn, Shopify App Store, and Google Paid Search. I’d like to understand how each of these works on its own and in conjunction with the others to generate installations of the Slick Predict Recommends app.
First, I need to wrangle the marketing data (including dollars spent and impressions generated) and sales numbers (installations, in this case). Then, I can take a look at the correlations between sales and the different channels. This pre-modelling step can be really valuable. Sometimes it reveals promising associations.
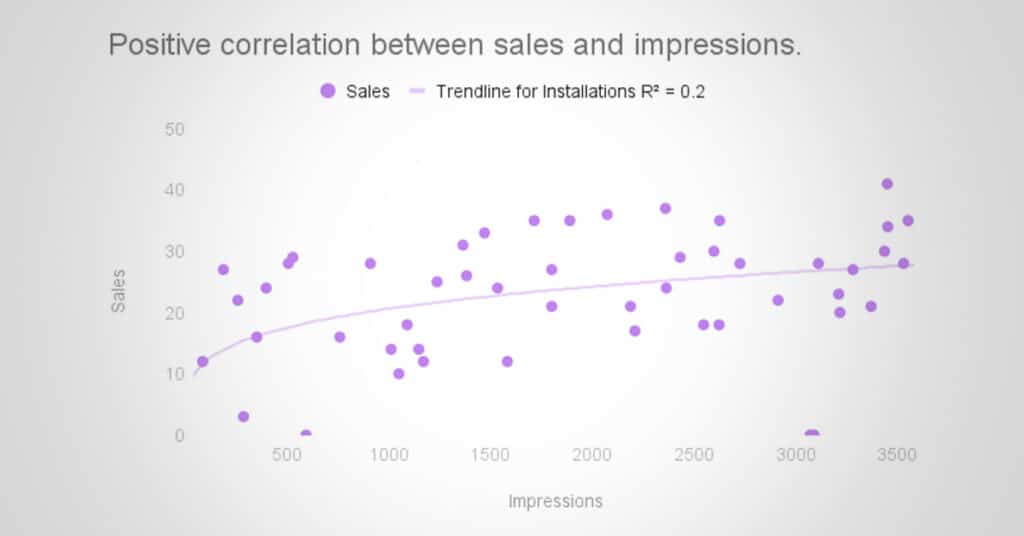
Other times it shows less-than-stellar, but still useful, insights.

After figuring out which channels hold promise and which ones don’t, it’s on to modelling. I’ll spare you the details, since they’re a bit inside-baseball (incorporating adstock, handling collinearity, removing hidden confounds, etc.) and skip ahead to the results.
What can it do?
Once the model’s built, we can take a holistic look at how Slick Predict’s marketing has impacted sales. Waterfall charts are my favorite way to do this. This chart shows how many sales came from each marketing channel (you can do the same for campaigns or even keywords):
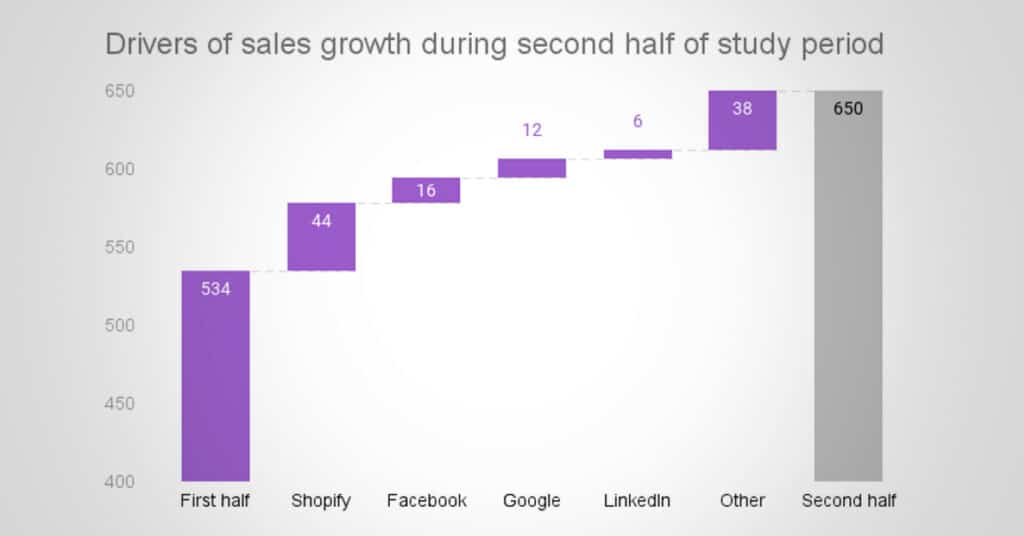
Slick Predict gained 116 (hypothetical) installations from first half of the study to the second. Most came from marketing impressions in the Shopify App Store, which makes sense as that’s lowest channel in the purchasing funnel. On the other hand, LinkedIn didn’t lead to all that many installations.
This chart goes a long way to clarifying how marketing has affected sales, but there’s a glaring omission: money!
It turns out that we can calculate each channel’s financial return with the numbers above and user lifetime value (LTV). I find that most companies already have a version of LTV lying around for financial projections. (If not, don’t worry, just use a reasonable estimate of revenue per sale.) With that, we can calculate each channel’s ROI, ROAS, or whichever financial metric feels right.
Here’s a ranking of Slick Predict’s (simulated) marketing efforts based on ROI:
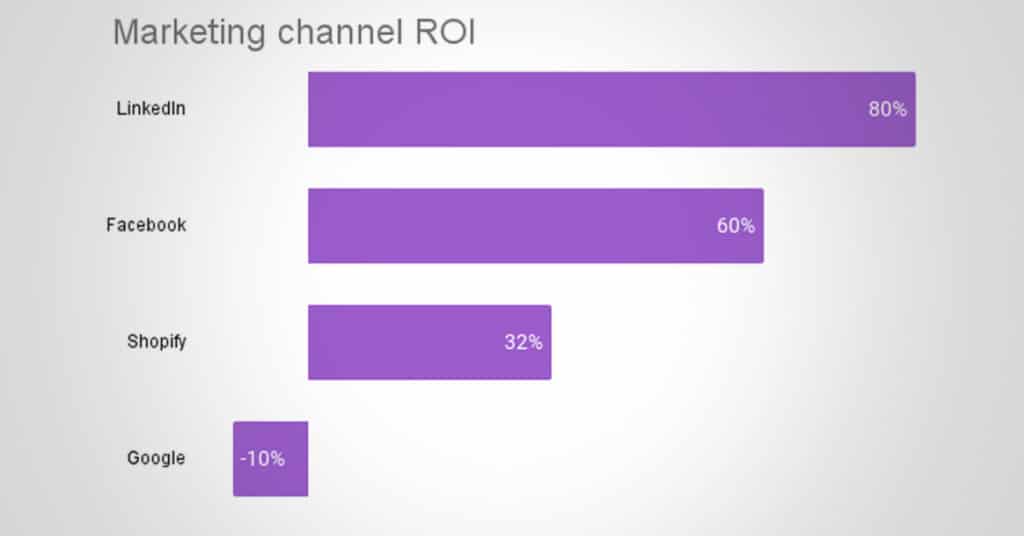
Sometimes the channel with the fewest attributed sales is so cheap that it’s the best place to allocate budget!
Moving on from consumer tracking
I find that one of the biggest concerns about probabilistic attribution is the mistaken assumption that it will be impossible to understand the financials, allocate budget effectively, or assign sales to different campaigns. Hopefully this post cleared up doubts you may have harbored on that front.
With so many changes around consumer privacy, tracking’s going to get more and more difficult – making traditional multi-touch attribution impossible for most businesses. Thank goodness there’s another way!